A successful SEO strategy should be monitored consistently and its data analyzed. Your sixth sense may sound great when deciding to buy a shoe, but not at all appropriate when planning for SEO. Google Analytics/Google Analytics Report is a rich source of data and most importantly free.
However, many people are not able to access all of its data and only use it as a transient report. For example, ranking keywords in search results can be an attractive report for you and your customers, but not very effective in future SEO planning.
Better SEO planning and more success require us to analyze and use more applied data. There are many cases of this data, but in this post, we are going to introduce the most important and key Google Analytics reports that play an important role in SEO.
Many of these reports can be customized to fit the needs of your clients. Stay tuned to be able to accurately evaluate your SEO efforts.
Does Google Analytics Help SEO?
The short answer? Yes.
Google Analytics contains valuable data that your business can use to monitor (and improve) SEO performance–from keywords to organic pageviews.
Here are 15 use cases that show how our experts use Google Analytics for SEO:
- Sync your Search Console account
- Create SEO-related goals
- Use the organic visitor’s segment
- Compare non-organic visitors to organic
- Find top-performing content
- Look at top-performing landing pages
- Use the Content Drilldown report
- Add annotations to track content updates
- Use the Multi-Channel Funnel report
- Track keywords in Google Analytics
- Find referral sites
- Manage your PPC spend
- Check how Google views your website
- Create custom dashboards
- Set up alerts
search the above items to find more information about Google Analytics for SEO.
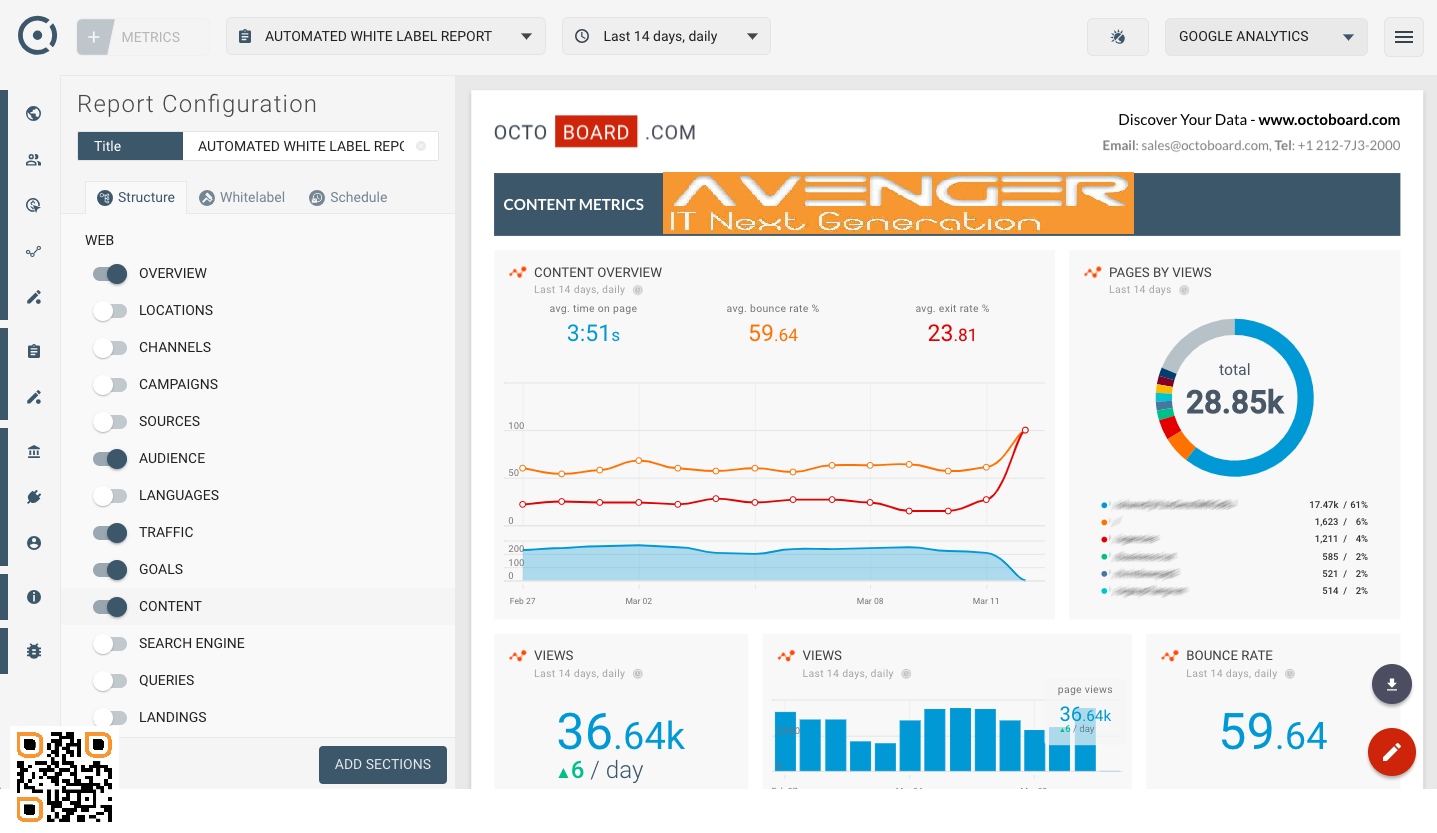
Before we dive in with the details about the most important Google Analytics reports, start getting to grips with the data inside your account with our Google Analytics SEO dashboard. You’ll be able to view the most popular metrics by the page on your site:
1. Organic Search
Path: Acquisition> Overview> Organic Search
This is one of the clear sections in Google Analytics that many people are familiar with. To go to the Acquisition menu, first select Overview. In this new page, you will see a summary of your top natural inputs and you will find details on traffic volume, user behavior and conversion rates from each source.
By clicking on the Organic Search filter you will see site data based on search engines. The most popular search engine referenced landing pages, a summary of keywords searched, search engines that generate the most traffic, exit pages, ban sheets and more can be viewed and analyzed here.
Be more careful about Bans Wright and check the pages one by one. Remove pages that have higher than average site rankings and find out why. Test the user experience of those pages and make any necessary corrections to them.

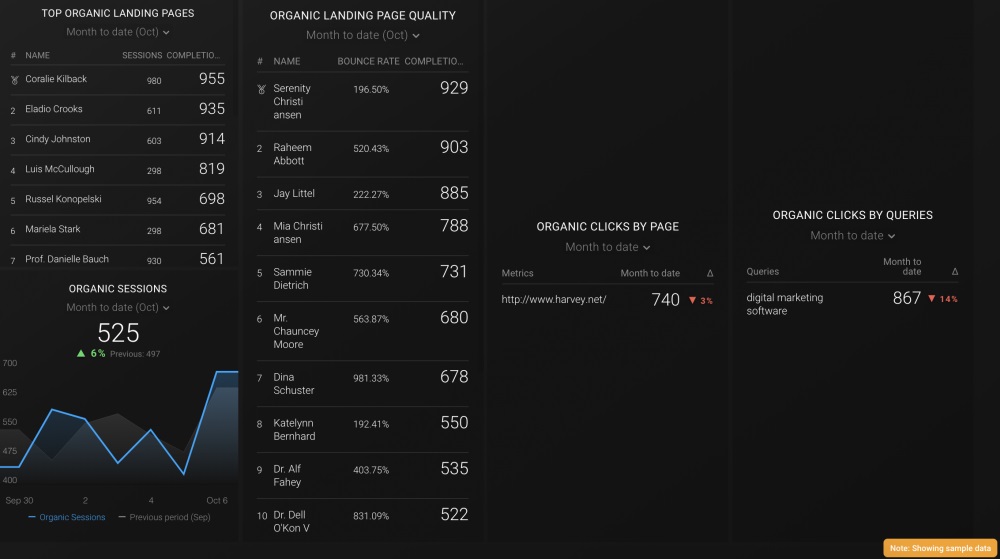
2. Landing pages and title pages
Path: Behavior> Site Content> Landing Pages
One of the problems with Google Analytics in the keywords section is that many searches do not specify the keyword searched by the user. This happens when the user is using a Google search engine in HTTPS mode or has checked the option to hide this information after logging into their account. Unfortunately, there is no solution to this, but there is an alternative solution that can help us somehow.
By going to the landing pages section you can find the pages that have the most input from natural search results. By looking at the landing pages and phrases in which those pages are optimized, you can almost have a small analysis of the search terms.
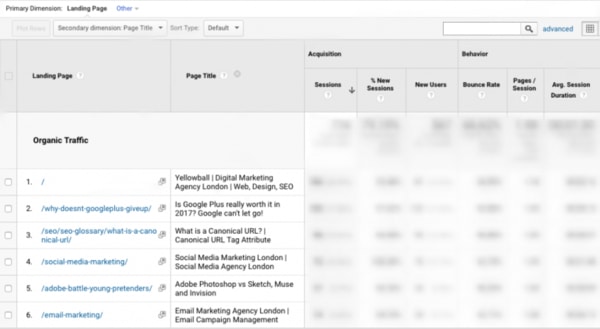
In this section, you can even identify pages that do not appear in search results that are not considered as site entries. Then check the SEO parameters for that page and troubleshoot it.
3. Conversion rate
Path: Conversions> Goals> Overview
Having a lot of traffic to a website is important. But more importantly, this traffic generates customers and so-called conversion rates. For this reason, you should follow the conversion rate. This can be analyzed on two levels.
The first level is to find the conversion rate ratio. You can check this ratio at different entries (search engines, direct traffic, …).
The second level is to monetize each of your conversions to show customers a better understanding of the value of your site. Some people only pay attention to the site’s ranking in the search results, and some others only care about their earnings. To extract credible information, you can work with your customers to find the revenue from each user-to-customer conversion.
For example, if you are a knife seller on your website, find the average cost of selling each knife as well as the profit from each to extract the average sales of each knife.
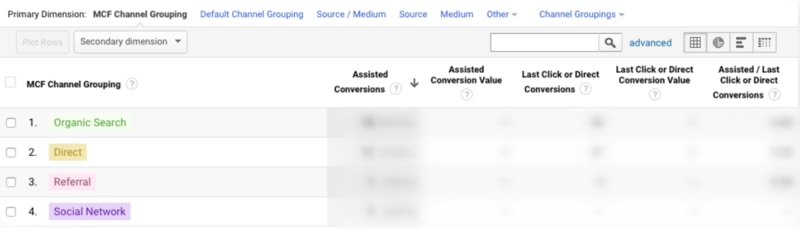
4. Auxiliary conversion rate
Path: Conversions> Multi-Channel Funnels> Assisted Conversions
Conversion rates can also make sense in other ways. For example, suppose a user first visits your site but doesn’t make any purchases from you. But on his next visit in the next few days, he will directly type in the URL and make the purchase.
This is very common among users. In the first phase of the search, they check out their favorite product on several websites and then go to their chosen site and finalize their purchase. Usually the next time a URL is typed directly or they have bookmarked a product page link.
Using Assisted Conversions, you can track the journey for purchase from start to finish and obtain more accurate data on the quality of site traffic.
Take great care to drop the charts here. For example, if the conversion rate in this area has fallen sharply, but the total traffic has remained constant, it may indicate that you should re-examine your site’s keywords and content generation strategy.
5.Site Speed
Path: Behavior> Site Speed> Overview
The speed of the site is very important and this is not covered by anyone. Many tools on the Internet can be used to check site speed. These include Google Page Insights, Pingdom, and GTmetrix. But these tools do not explore the site internally and merely check the page we are looking for. Google Analytics site speed reporting can help you identify slow pages.
You will probably see a code that is a direct link between slow pages and exit pages. Also on these pages, you can check out their ban-sheet and you will probably find that it is above average.
Using this information, the site development and design team can troubleshoot slow page problems and fix them.
6. Site Search
Path: Behavior> Site Search> Search Terms
If you have a search module on your site, this can be very useful for many reasons. First of all, this report can demonstrate the power of the site’s user experience. If you can’t find a page without searching, then there is a problem with the site navigation structure.
Also, reporting this section can help us identify keywords that users are likely to search for, but that there is no landing page. This report helps us fill existing chats by building new pages and producing relevant content.
7. Mobile
Path: Audience> Mobile> Overview
Comparing mobile, tablet, and desktop versions of site traffic can be a surefire way to find problems with mobile optimization. For example, if Bans Wright’s mobile version of the site is significantly more than the desktop version, then it may be worth checking out the SEO site.
Also comparing conversion rates across devices can help you figure out which version of the site is more valuable and cost-effective.
Given that, on average, half of all site traffic is from mobile devices, a proper comparison can be made between these versions. Also, keep in mind that many businesses today are more focused on mobile.
For example, local businesses are more frequently searched on mobile devices, while B2B services are more frequently searched on desktops by people sitting in their office and behind a computer.
8. Customize Google Analytics dashboard
Path: Customization> Dashboards
To provide your clients with a summary of your business report, you need to design a simple and appropriate dashboard for your clients. It is often seen that customers cannot communicate with complex charts and detailed reports, and it is annoying to see such complex charts at first glance.
You may be a Google Analytics expert, but your customers aren’t capable of analyzing statistics. So delivering data in a way that is digestible to your customers is key to convincing them of your site’s progress.
Create a dashboard for your customers that is understandable. Use understandable charts like simple charts and tables to do this. This can help customers visualize the data easily and email them weekly.
Google Analytics dashboard can be customized through widgets. Various widgets include simple metrics, timelines, maps, tables, and charts. Some of these widgets can also set the timestamp, while others can display instant statistics.
Google Analytics has many types of reports that require a lot of time and practice to learn all of them and their formats. This list can be a good start to learning about them and reporting to customers.
Conclusion
These are just a few of the opportunities you can tap into Google Analytics.
Using this free tool to its full potential can help drive very valuable marketing insights that can help formulate stronger SEO strategies.
ABOUT US
Working with Digital marketing, SEO services, and website design with a highly experienced team for years, َAvenger IT Next Generation has been able to meet the needs of people in various businesses and help businesses grow. Continuously updating their level of knowledge and exploring different markets has surpassed the pioneers in this field and incorporate successful experiences into their careers.
Avenger IT Next Generation is a website design and development agency and an SEO agency to promote your business, call with us.
