What is an infographic? The 12 common types and the 6 stages of its creation
Infographic or uses a combination of information and attractive graphic elements to deliver content faster and better. Infographic is widely used in graphic content production, which is one of the types of content marketing. In this article, we will introduce you to how to design and design an infographic in 2 steps and 2 common types.
Infographics are visual displays of information and data that aim to provide complex information quickly and easily
What is Infographic?

To describe the infographics, let’s first start by describing the word infographic itself. Infographics are a combination of two words information and graphic. In essence, an infographic is a form of visual communication that is designed to draw attention and increase understanding. In this era of the infographics, it has become the most widely described of any particular type of visual communication, including graphics that represent data, data copying, or both. You may have seen infographics in online magazines or on the wall in your doctor’s office.
Designing and manufacturing of infographics
Recognizing the audience for infographic
Infographics are not just about design. You need to provide information through graphics, and to do so you need to know the target audience.
According to the Harvard Business and Marketing department, there are 5 categories of the audience that can change the way you select and visualize your data, including 5 Newcomers, publicists, executives, professionals, and executives.
You have to distinguish your ideal audience from these five categories and begin building infographics for that audience. When thinking about the data you want to design, you need to think about all five categories of contacts above. For example, a novice audience may need information that makes sense too simple or a specialist might be more interested in seeing your ideas. Or, for example, an executive is more likely to share with a new audience because they have little time and you need to provide them with the simplest and most important information and its impact on the business.
Collecting relevant content and data
After selecting the contact mentioned in the first section, the next step is to organize all the content and data you want to use infographics. You can collect third-party data or use your primary data. Only if you use third-party data should you be sure to cite your sources correctly? Just like any other content production.
• Organize data
When collecting your information, make sure you know what you want to provide the audience with. Inappropriate data and information will give no value to your infographic.
• Cite sources
The best way to build an infographic with different sources is to list them at the end of the infographic by mentioning their URL (URL) and the link that links it to your page. You can also list a list of personal sources you used and mention them in your infographic.
This way your infographic will be clean and professional. However, people may still be sharing your infographic regardless of the sources listed, or it may even cause more visitors to your site.
Select the desired text format
The next step in creating an infographic is to choose a suitable template for displaying this data. The most important thing is to choose a template that is specifically designed for the type of data you want to provide. There are many templates and templates that you can choose from depending on your data type. Here are some basic ideas for choosing the right information format:
• Comparative infographics
This type of infographics design can help to prove the advantage of one concept over another, or simply explain the difference between two competing entities.
Flowchart infographics
This infographic design is perfect for presenting a new workflow to an organization or illustrating how a linear or cyclical process works in the industry.
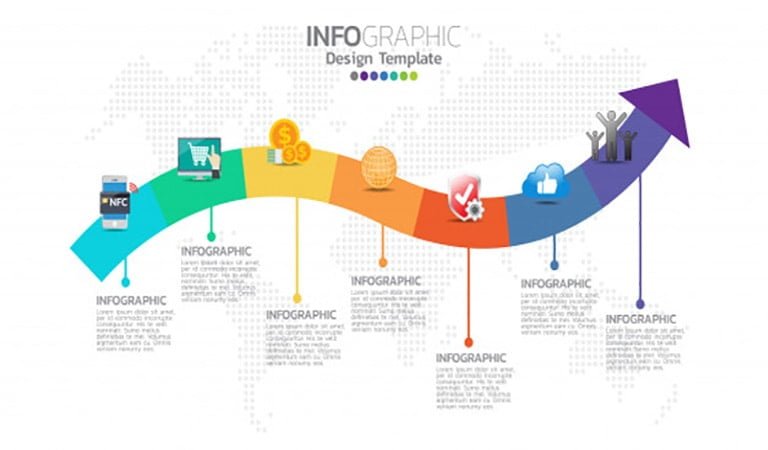
• Timeline infographics
It can tell the historical story of a particular business, industry, product, or concept.
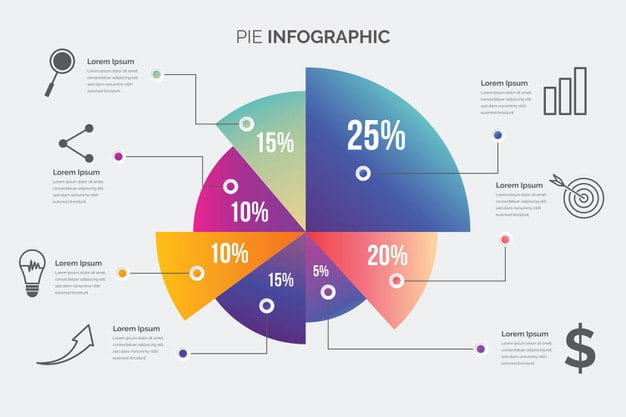
• Infographics chart

This design is suitable for content creators who publish large amounts of data and insights and make it specialized for their audiences.
• Heavy visual infographics
This design is suitable for those who want to display information through shapes, designs, or photos and is not suitable for figures and figures.
Download the PowerPoint template
The next step is selecting the PowerPoint template. You can choose the best PowerPoint format depending on your data type. For example, if your infographic is defined in a timed format, you need to select the appropriate PowerPoint to properly cover all of your content.
Infographics customization
This part takes more time, but it’s also the fun part of designing an infographic. To do this, just have a catchy title, plug in your content information, and then adjust your font size and formatting. You can also change the graphics and colors in this section, depending on your brand and the information you want to provide. For other formats, you can use simple charts and charts provided by PowerPoint to create the base chart. You may even need to add or change a specific font color or style to customize an infographic.
2. Put footers, resources, and logos
In the end, you should add the required footers, resources you have used and your brand logo to Infographic. It won’t take you much time. One of the main advantages of the infographic is its sharing capability.
Insert Pinterest Code and Button (Pinterest)
All you have to do is publish and promote the awesome content you’ve prepared. As we said before, we recommend using your blog for infographic publishing. Your infographic should include a Pinterest button for visitors that can easily be added to your favorites. And also provide a replacement code for visitors so they can share it on their websites and blogs.
Common infographic types
The following are two common infographic types.
Data-driven

The data-based infographic focuses on a set of multiple and statistically significant data sets. This type of infographic often provides data images designed to support a particular subject. This type of infographic compresses information for easier comprehension in one place, but they need a smooth design so that the data can be transmitted clearly and concisely.
1- Time
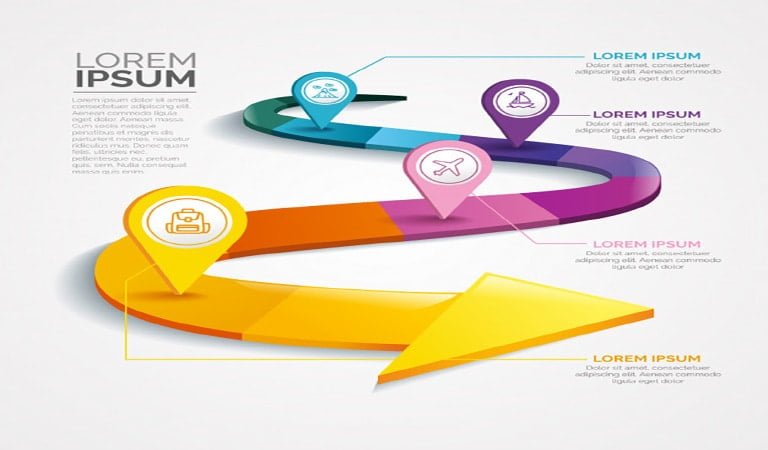
Most people are familiar with the occasional infographics, which is why this type of infographic is one of the popular types of infographics. Charts are used to explain the history and history of a topic or how it changes over time. This infographic is easy to understand and read because it shows multiple events in specific time order with a unique flow.
How-To

The “how” infographic is an answer to questions and an explanation of how to do a job using images. They try to convey something new to the audience. This kind of infographic is very well shared in social network marketing.
Geographical
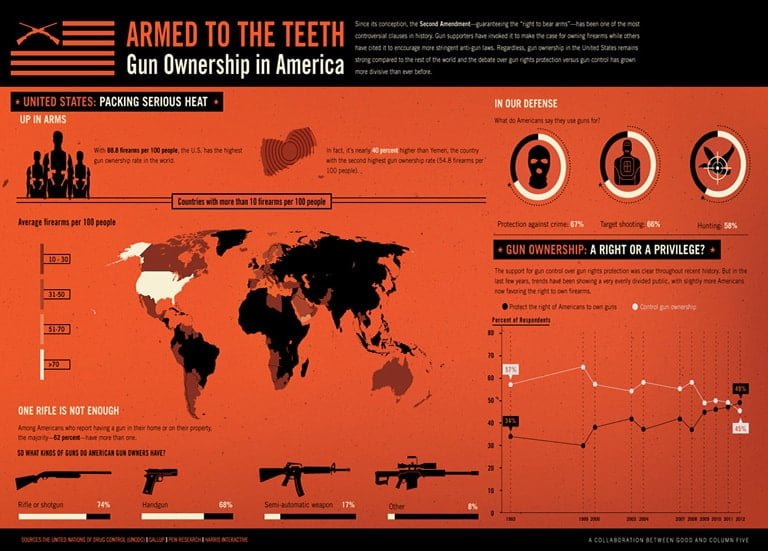
Geographical infographics show the trend of data by location. If you have geographic information and data that you want to visualize, we suggest using a map. Maps are a great way to create engaging stories. You can create a map that focuses entirely on your infographic or help move your information from a map.
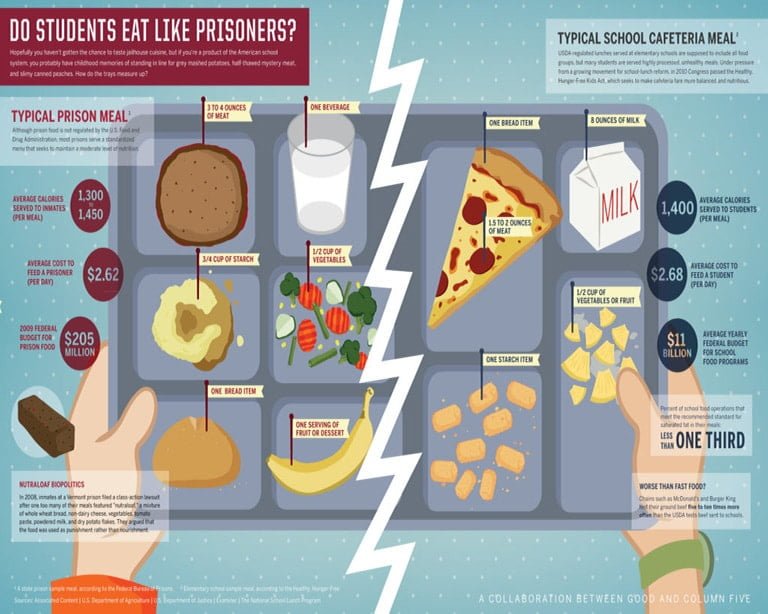
Comparative
Comparative infographics are also one of the most popular types of infographics. They usually compare two different issues together. This type of infographic is used to illustrate the commonality, disagreement, or superiority of two issues.
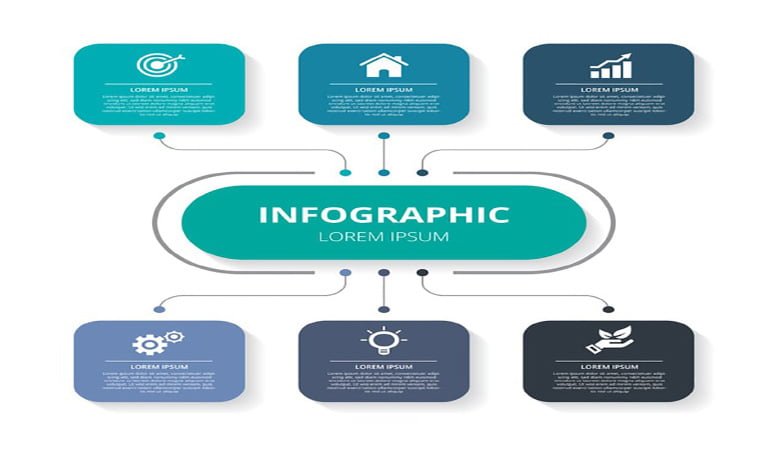
Hierarchical
A hierarchical infographic classifies information and data into preset levels. This type of infographic is shown to show how information is organized at different levels and how these levels are interconnected. This type of data is usually represented by a pyramid chart or flow chart.
Flowchart
Flowchart infographics are usually used to answer a specific question through a set of options that show the appropriate answer to these questions. This kind of infographic can also show how a subject is divided or reproduced.
1- List
Listed infographics are useful teaching tools that display a lot of information in text or icon format. This type of infographic is due to the high variety of popular types of infographics. It’s easy to see and understand their contents, while also displaying clear messages.
Anatomical or anatomical
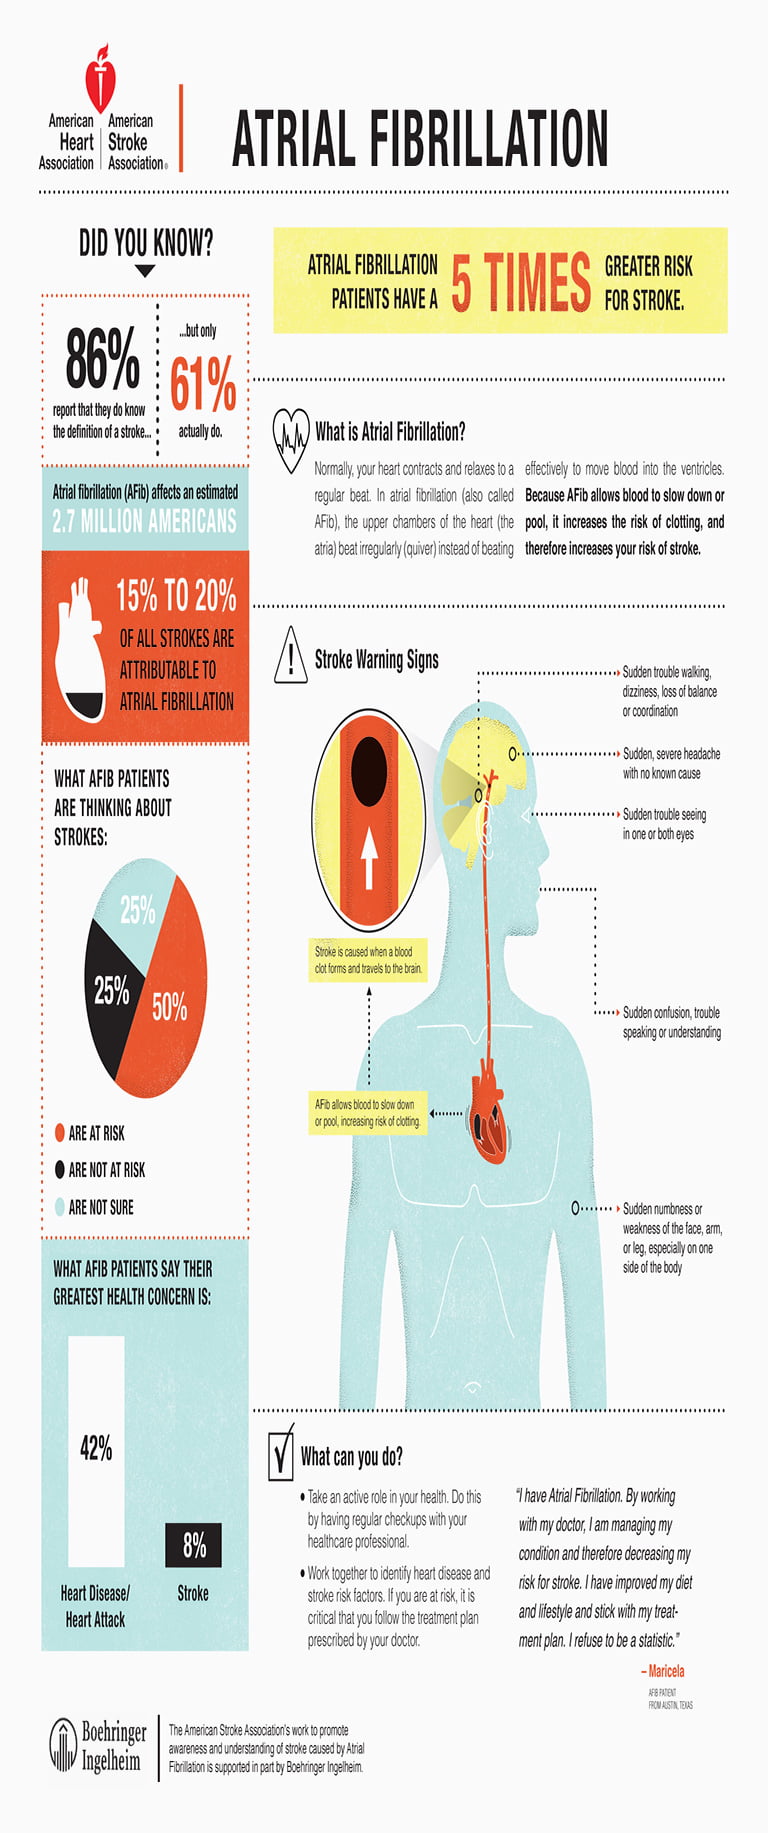
Anatomical infographics break down the structure of a subject and show how it is made and how it works. This infographic can be used on subjects such as biology, architecture, food, and so on.

Visual resume infographics are rapidly becoming popular. This kind of infographic makes you different. This type of resume is a great alternative to traditional resumes for those who are looking for a job. You can easily present your experiences, skills, and goals in this way.
Photo-based
This type of infographics can be photo-based or image-based. In general, we use imagery to help visualize life’s concepts and stories. Photo-based infographics provide a unique and eye-catching experience.
Communication
Infographics is a web-based and awesome communication. This kind of infographic allows the audience to communicate with complete information and often enables them to zoom in on interesting statistics and images. We love this kind of infographic because it encourages people to discover and interact with the subject themselves.
ABOUT US
Working with Digital marketing, SEO services, and website design and Migrating services to PWA with a highly experienced team for years, َAvenger IT Next Generation has been able to meet the needs of people in various businesses and help businesses grow. Continuously updating their level of knowledge and exploring different markets has surpassed the pioneers in this field and incorporate successful experiences into their careers.
Avenger IT Next Generation is a progressive and insightful design agency, technically and creatively skilled to translate your brand into its best digital self. Our design and development approach creates impactful, engaging brands, and immersive digital experiences that bring you a return on creativity, call with us.
The network services section of Avenger IT Next Generation has three main titles:
- Consulting services and network solutions
- Installation and realization of network projects
- Network support and maintenance services
These services take the form of short and long-term contracts for network support and maintenance and in the form of projects and cases in the field of consulting and the implementation of networks for businesses, institutions, various industries. , medical and educational centers, large commercial office complexes, petrochemicals, factories, small organizations. , Medium and large, and is provided.
